As a part of creating my 47374.info site that tracks local news headlines and related info, I have an automatically-gathered historical record of the daily COVID-19 data updates published by Reid Health. I thought it would be interesting to visualize that information to see how we’re doing over time.
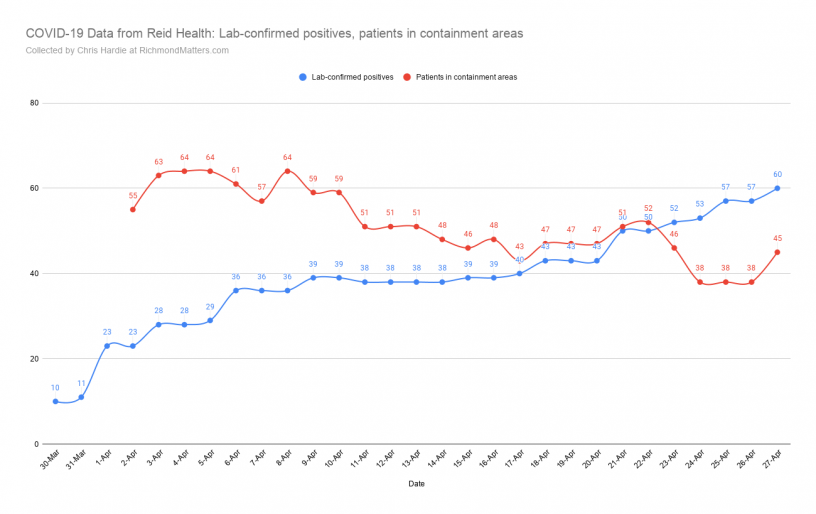
Here’s the trend of lab-confirmed positive cases along with the number of patients in containment areas:

I see an uptick in patients in containment areas as of today, and a general trend of growth in positive cases after that line was flat for a while…hopefully nothing to worry about.
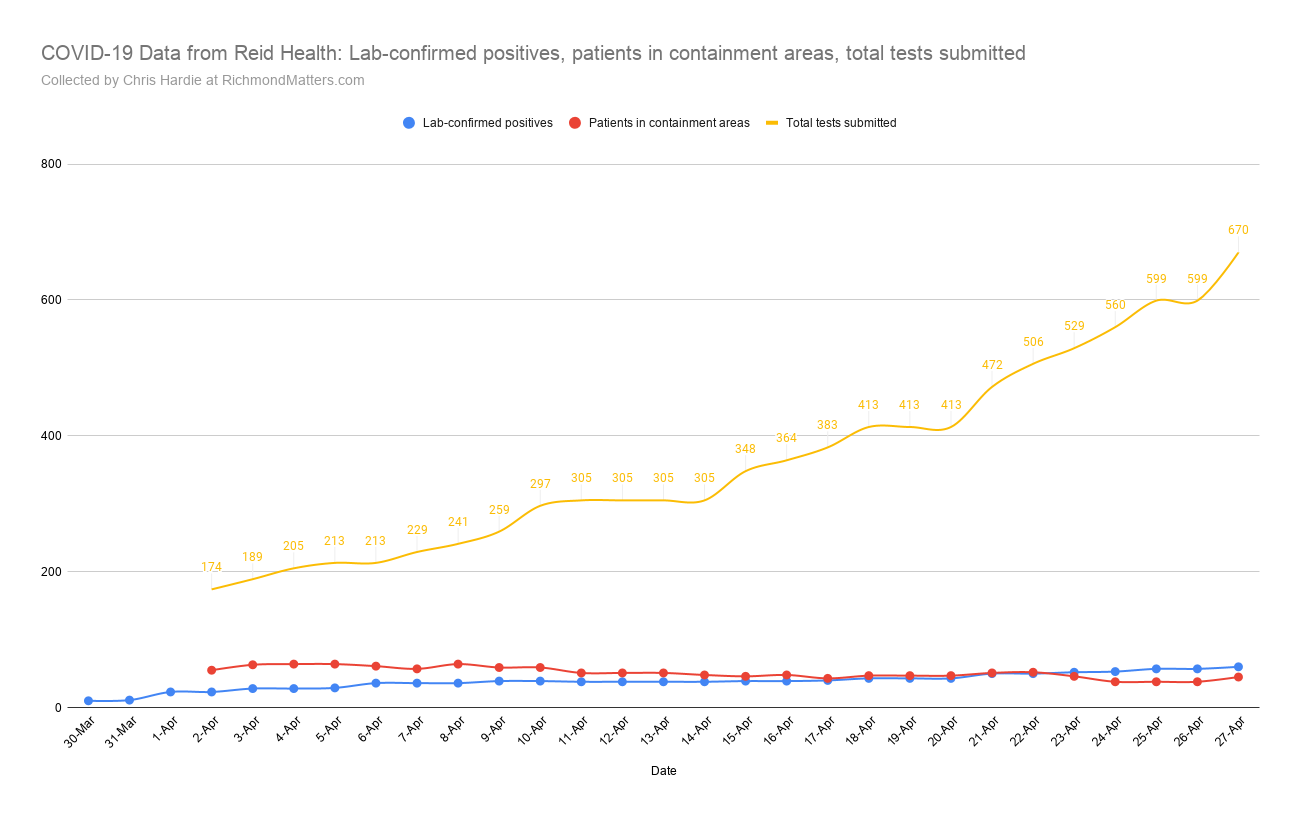
Here is the same information, but with total tests submitted added in to the mix:
This is based on the information published by Reid Health on a mostly-daily basis on their website, but any errors are mine.
You can see the underlying spreadsheet and individual daily counts here.
Because Reid doesn’t publish the data in a structured way, I’ve created a JSON feed of the latest numbers that is automatically updated on a regular basis from their website. If you’d like to build your own visualization or reporting tools with the data, feel free to query it.
 Hi - I'm Chris Hardie. I live and work in Richmond, Indiana.
Natalie Wise
Thanks for organizing the information.
Sayward Salazar
It seems like folks did not social distance over Easter….