Kicks 96 News pointed out that the latest Indiana county health rankings from the Robert Wood Johnson Foundation and the University of Wisconsin Population Health Institute have been released.
Wayne County, Indiana ranks 60 out of 92 counties in the state overall, and while we come in in the 40s for “Physical Environment,” “Clinical Care” and “Health Behaviors,” we’re almost last at 86 for “Social & Economic Factors.”
I know what you’re thinking. Why would we let people from Wisconsin – a state globally known for its unhealthy and hedonistic over-consumption of cheese – tell us how we’re doing as a county? That would be like letting a doctor who was educated at some fancy out-of-state medical school diagnose your broken arm. We’ll just let it be broken and if it falls off, it falls off, thank you very much.
But once we get past that initial indignation, there are some interesting stats here. We tend to do better than the rest of the state in areas like:
- Number of mental health providers per capita
- Avoiding long commutes driving alone
- Factors contributing to a healthy food environment
- Percentage of adults reporting heavy or binge drinking (though that’s self-reported, not actual)
- Number of membership associations per capita (we love our membership associations!)
Some areas where we’re not doing so great include:
- Violent crime trends: as violent crime has come down in the U.S. and Indiana overall, it’s stayed about the same or even gone up in Wayne County
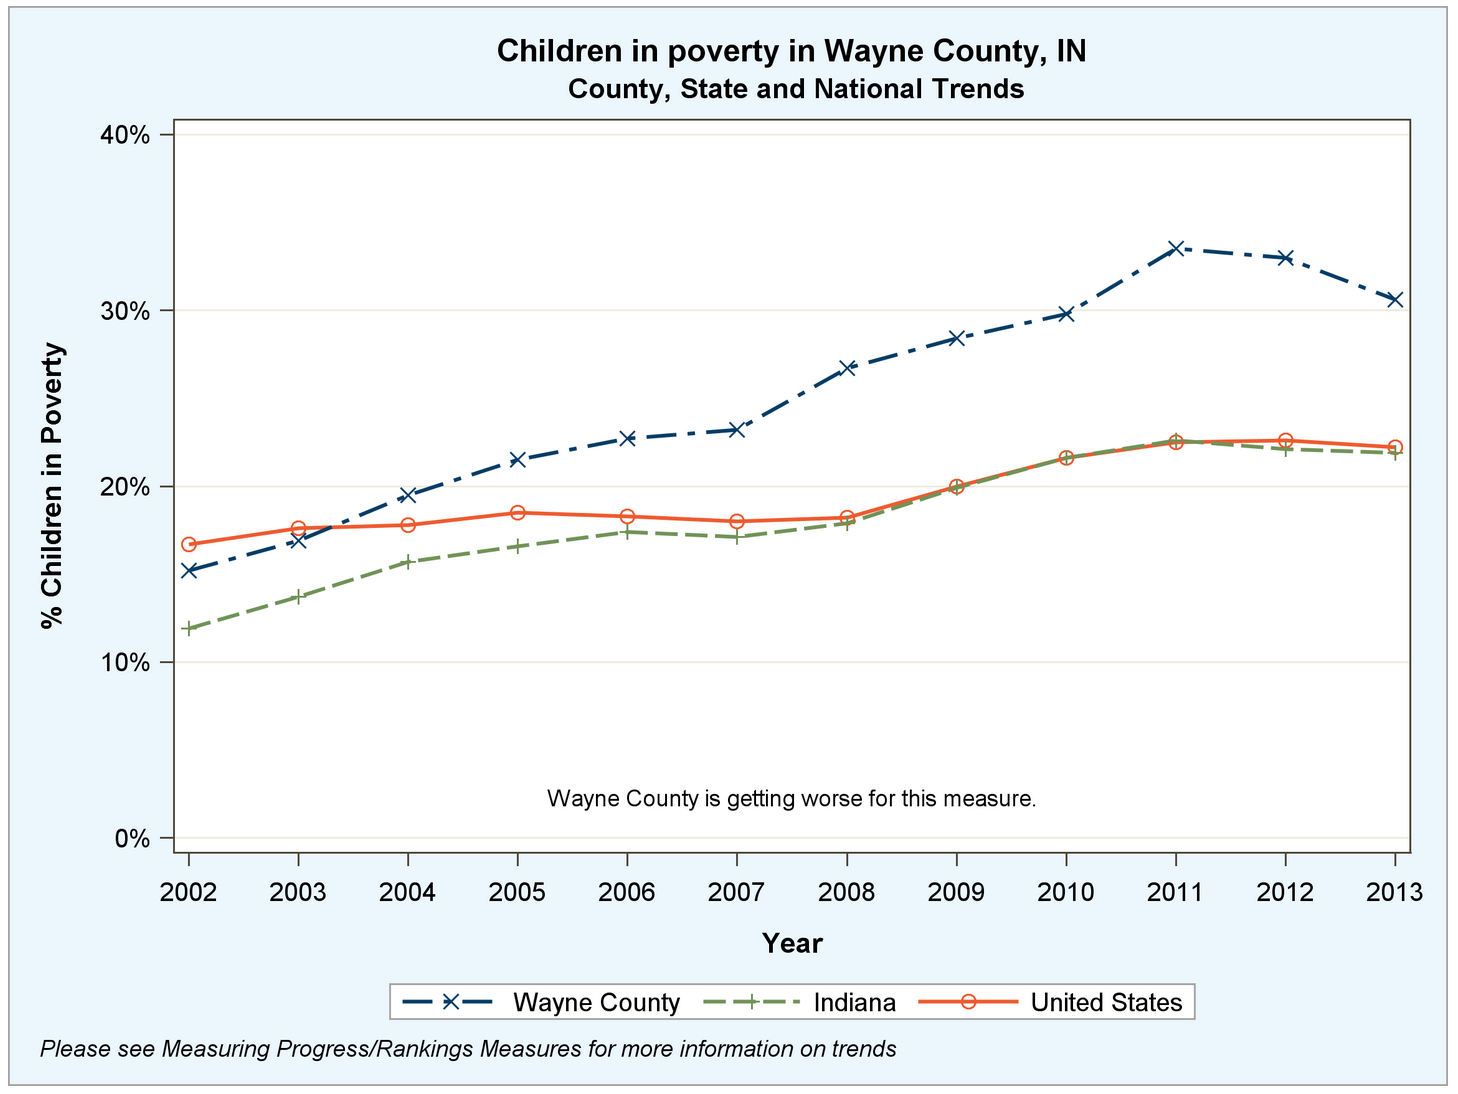
- Children living in poverty: we’ve stayed well above state and national trends here
- Teen pregnancy and births
- Income inequality
- Children living in single-parent households
- Adult smoking
Highlighting these issues doesn’t have to be about getting down on ourselves.
Too often in public conversation about “what Richmond and Wayne County need” we get bogged down with popular narratives and speculation instead of looking at hard data. Hard data doesn’t tell the whole story, but it tells us a bunch of stories at once, woven together from research and analysis that goes beyond our personal experiences.
And it gives us something to act on. In some cases it gives us some things to be embarrassed about, even outraged about. We can’t always control these numbers (Is there a public policy change that would lead to greater access to exercise opportunities? Maybe, maybe not.) but for many of them, we have the opportunity to try to move the needle if we decide that it’s important to do so.
Check out the numbers. See what surprises you. See what moves you. And then bring that information into your next conversation about the future of the community.
 Hi - I'm Chris Hardie. I live and work in Richmond, Indiana.
Leave a Reply